MOVIE of UVCS Slit on LASCO Images
CME 19990508
| Tutorials: UVCS CME Observations pdf / html | UVCS CME Catalog Pages html |
| Table 1 - General Information |
| CME ID |
Time (UT) |
PA (deg) |
Speed (km/sec) |
Acceleration (m/sec2) |
Mass (g) |
Type II RB |
X Flare |
| 19990508.015005.p278g |
01:50 |
281 |
569 |
13.1* |
1.0e+15 |
No |
Yes |
| Table 2 - UVCS Observation Sequence |
| FITS filename |
PA (deg) |
T i (UT) |
Tf (UT) |
Height (Rsun) |
Slit W. (arcsec) |
Exp. Time (sec) |
| d99.05.08.01:44:31.ovi.dat |
270 |
01:45:02 |
01:51:42 |
1.50 |
28 |
200 |
| 01:52:29 |
01:59:09 |
1.60 |
28 |
200 | ||
| 01:59:54 |
02:08:54 |
1.70 |
28 |
180 | ||
| 02:10:59 |
02:19:59 |
1.80 |
28 |
180 | ||
| 02:21:57 |
02:33:57 |
2.00 |
28 |
180 | ||
| 02:36:12 |
02:51:12 |
2.30 |
28 |
180 | ||
| 02:54:14 |
03:19:34 |
2.80 |
28 |
200 | ||
| 03:22:22 |
03:57:02 |
3.50 |
28 |
200 |
| UVCS Slit Position |
|
MOVIE of UVCS Slit on LASCO Images |
| Table 3 - UVCS Observation Wavelength Range |
| FITS filename |
Wave Min (A) |
Wave Max (A) |
| d99.05.08.01:44:31.ovi.dat |
1023.20 |
1043.70 |
| 980.400 |
993.400 |
|
| 1208.70 |
1220.60 |
|
| 975.800 |
979.200 |
|
| 1221.80 |
1224.90 |
| Table 4 - UV Properties |
| First Obs. | Max blue-shift (km/sec) | Max red-shift (km/sec) | Detected at (Rsun) | Lines |
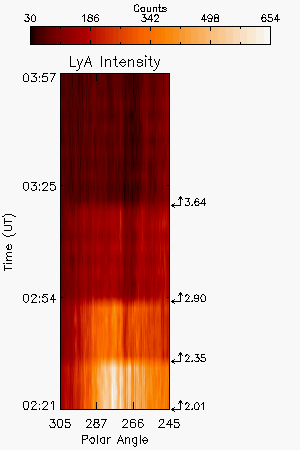
| 199/05/08 02:36 | 0 | 172 | 2.35, 2.90, 3.64 |
HILya1216 OVI1032 OVI1038 |
| Images |
| Intensity Images |
LyA Intensity shown as depletion of material, background corona not subtracted. |
|
| Interpretation |
| Front | No |
| Void | ? |
| Shock | No |
| Current Sheet | No |
| Prominence | ? |
| Flare O VI | No |
| Leg | No |
| Helix | No |
| Comments |
The red-shift material showed as a very thin stripe in O VI and LyA and seems to be within the LyA gap.
Last Update Wed May 28 18:41:10 2008