CME 19990318
| Tutorials: UVCS CME Observations pdf / html | UVCS CME Catalog Pages html |
| Table 1 - General Information |
| CME ID |
Time (UT) |
PA (deg) |
Speed (km/sec) |
Acceleration (m/sec2) |
Mass (g) |
Type II RB |
X Flare |
| 19990318.092605.p181s |
09:26 |
190 |
234 |
-4.8* |
4.9e+14 |
No |
Yes |
| Table 2 - UVCS Observation Sequence |
| FITS filename |
PA (deg) |
T i (UT) |
Tf (UT) |
Height (Rsun) |
Slit W. (arcsec) |
Exp. Time (sec) |
| d99.03.18.09:59:05.ovi.dat |
135 |
10:00:18 |
10:05:18 |
1.50 |
28 |
100 |
| 10:07:04 |
10:15:24 |
1.75 |
28 |
100 | ||
| 10:17:18 |
10:28:58 |
2.00 |
28 |
100 | ||
| 10:31:06 |
10:46:06 |
2.25 |
28 |
100 | ||
| d99.03.18.10:51:47.ovi.dat |
180 |
10:53:00 |
11:08:00 |
1.50 |
28 |
300 |
| 11:09:50 |
11:34:50 |
1.75 |
28 |
300 | ||
| 11:36:50 |
12:11:50 |
2.00 |
27 |
300 | ||
| 12:13:53 |
12:58:53 |
2.25 |
27 |
300 | ||
| 13:01:14 |
13:56:14 |
2.50 |
27 |
300 |
| Table 3 - UVCS Observation Wavelength Range |
| FITS filename |
Wave Min (A) |
Wave Max (A) |
| d99.03.18.09:59:05.ovi.dat |
1023.20 |
1043.70 |
| 980.400 |
993.400 |
|
| 1208.70 |
1220.60 |
|
| 975.800 |
979.200 |
|
| 1221.80 |
1224.90 |
|
| d99.03.18.10:51:47.ovi.dat |
1023.20 |
1043.70 |
| 980.400 |
993.400 |
|
| 1208.70 |
1220.60 |
|
| 975.800 |
979.200 |
|
| 1221.80 |
1224.90 |
| Table 4 - UV Properties |
| First Obs. | Max blue-shift (km/sec) | Max red-shift (km/sec) | Detected at (Rsun) | Lines |
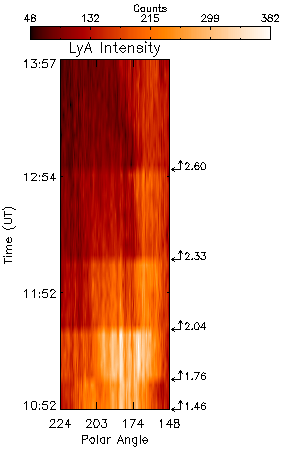
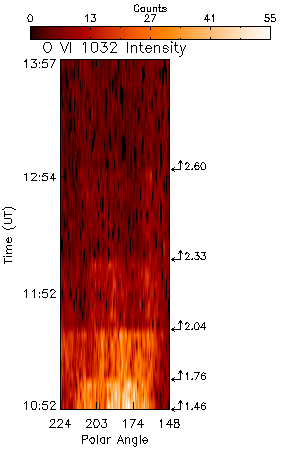
| 1999/03/18 10:53 | 0 | 0 | 2.33, 2.60 |
HILya1216 OVI1032 OVI1038 |
| Images |
| Intensity Images |
|||
| Interpretation |
| Front | No |
| Void | ? |
| Shock | No |
| Current Sheet | No |
| Prominence | ? |
| Flare O VI | No |
| Leg | ? |
| Helix | No |
| Comments |
The morphology in line intensity seems to change but it's hard to pick out specific transient material.
Last Update Tue May 19 12:00:01 2009