MOVIE of UVCS Slit on LASCO Images
CME 19990311
| Tutorials: UVCS CME Observations pdf / html | UVCS CME Catalog Pages html |
| Table 1 - General Information |
| CME ID |
Time (UT) |
PA (deg) |
Speed (km/sec) |
Acceleration (m/sec2) |
Mass (g) |
Type II RB |
X Flare |
| 19990311.112605.p128s |
11:26 |
127 |
281 |
4.7 |
2.1e+15 |
No |
Yes |
| Table 2 - UVCS Observation Sequence |
| FITS filename |
PA (deg) |
T i (UT) |
Tf (UT) |
Height (Rsun) |
Slit W. (arcsec) |
Exp. Time (sec) |
| d99.03.11.10:54:13.ovi.dat |
135 |
10:55:27 |
11:00:27 |
1.50 |
28 |
100 |
| 11:02:16 |
11:10:36 |
1.75 |
28 |
100 | ||
| 11:12:33 |
11:24:13 |
2.00 |
28 |
100 | ||
| 11:26:16 |
11:41:16 |
2.25 |
28 |
100 | ||
| d99.03.11.11:47:04.ovi.dat |
180 |
11:48:15 |
12:03:15 |
1.50 |
27 |
300 |
| 12:05:06 |
12:30:06 |
1.75 |
27 |
300 | ||
| 12:32:07 |
13:07:07 |
2.00 |
27 |
300 | ||
| 13:09:13 |
13:54:13 |
2.25 |
27 |
300 | ||
| 13:56:33 |
14:56:33 |
2.50 |
27 |
300 |
| UVCS Slit Position |
|
MOVIE of UVCS Slit on LASCO Images |
| Table 3 - UVCS Observation Wavelength Range |
| FITS filename |
Wave Min (A) |
Wave Max (A) |
| d99.03.11.10:54:13.ovi.dat |
1023.20 |
1043.80 |
| 980.400 |
993.400 |
|
| 1208.70 |
1220.60 |
|
| 975.800 |
979.200 |
|
| 1221.80 |
1224.90 |
|
| d99.03.11.11:47:04.ovi.dat |
1023.20 |
1043.70 |
| 980.400 |
993.400 |
|
| 1208.70 |
1220.60 |
|
| 975.800 |
979.200 |
|
| 1221.80 |
1224.90 |
| Table 4 - UV Properties |
| First Obs. | Max blue-shift (km/sec) | Max red-shift (km/sec) | Detected at (Rsun) | Lines |
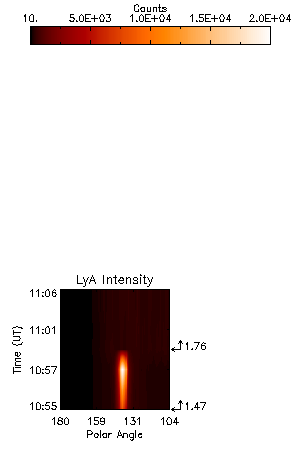
| 1999/03/11 10:55 | 0 | 0 | 1.46, 1.76 |
CIII977 OVI1032 |
| Images |
| Intensity Images |
||||
| Interpretation |
| Front | No |
| Void | ? |
| Shock | No |
| Current Sheet | No |
| Prominence | Yes |
| Flare O VI | No |
| Leg | No |
| Helix | No |
| Comments |
Some bright material showed at the top row of the slit in the data at PA=180 at 1.47 Ro, skimming the edge of the CME.
Last Update Tue May 19 10:43:29 2009