MOVIE of UVCS Slit on LASCO Images
CME 19981107
| Tutorials: UVCS CME Observations pdf / html | UVCS CME Catalog Pages html |
| Table 1 - General Information |
| CME ID |
Time (UT) |
PA (deg) |
Speed (km/sec) |
Acceleration (m/sec2) |
Mass (g) |
Type II RB |
X Flare |
| 19981107.205405.p314s |
20:54 |
321 |
750 |
23.7 |
------- |
No |
Yes |
| Table 2 - UVCS Observation Sequence |
| FITS filename |
PA (deg) |
T i (UT) |
Tf (UT) |
Height (Rsun) |
Slit W. (arcsec) |
Exp. Time (sec) |
| d98.11.07.21:11:44.ovi.dat |
315 |
21:12:34 |
21:17:34 |
1.50 |
28 |
100 |
| 21:19:21 |
21:27:41 |
1.75 |
28 |
100 | ||
| 21:29:33 |
21:41:13 |
2.00 |
28 |
100 | ||
| 21:43:19 |
21:58:19 |
2.25 |
28 |
100 | ||
| d98.11.07.22:04:26.ovi.dat |
360 |
22:05:17 |
22:20:17 |
1.50 |
28 |
300 |
| 22:22:03 |
22:47:03 |
1.75 |
28 |
300 | ||
| 22:48:56 |
23:23:56 |
2.00 |
28 |
300 | ||
| 23:26:01 |
00:11:01 |
2.25 |
28 |
300 | ||
| 00:13:22 |
01:13:22 |
2.50 |
28 |
300 |
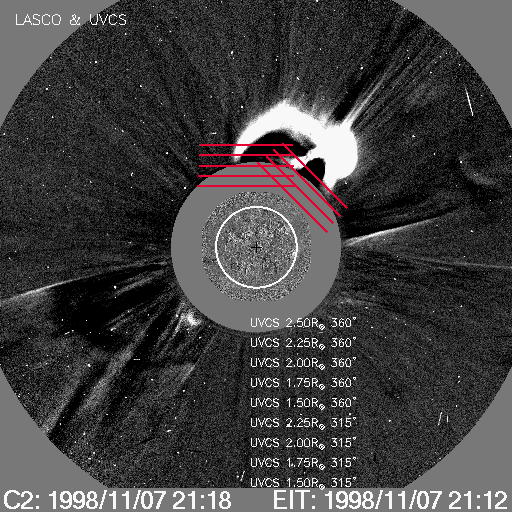
| UVCS Slit Position |
|
MOVIE of UVCS Slit on LASCO Images |
| Table 3 - UVCS Observation Wavelength Range |
| FITS filename |
Wave Min (A) |
Wave Max (A) |
| d98.11.07.21:11:44.ovi.dat |
1021.50 |
1043.50 |
| 975.500 |
988.600 |
|
| 1209.70 |
1221.80 |
|
| d98.11.07.22:04:26.ovi.dat |
1021.50 |
1043.50 |
| 975.500 |
988.600 |
|
| 1209.70 |
1221.80 |
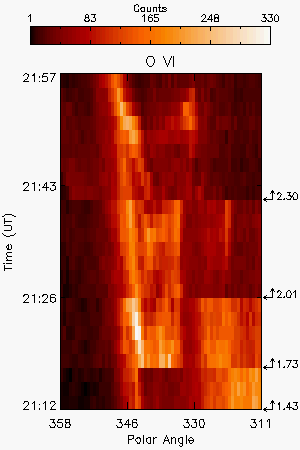
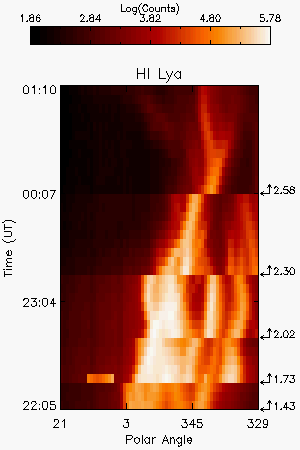
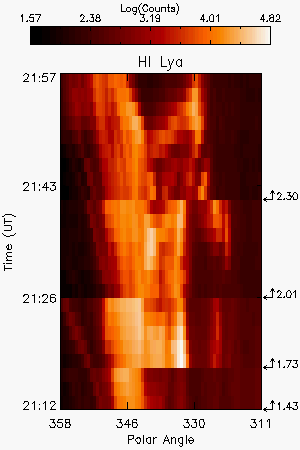
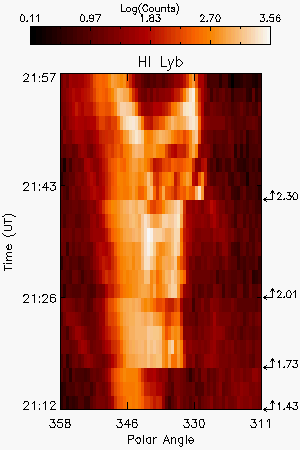
| Table 4 - UV Properties |
| First Obs. | Max blue-shift (km/sec) | Max red-shift (km/sec) | Detected at (Rsun) | Lines |
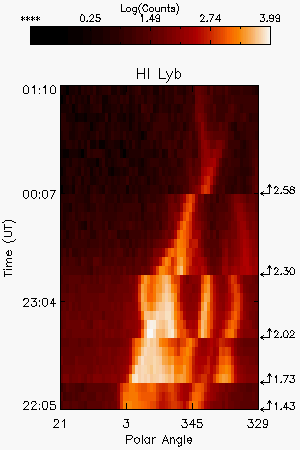
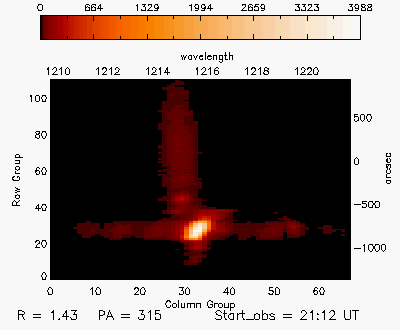
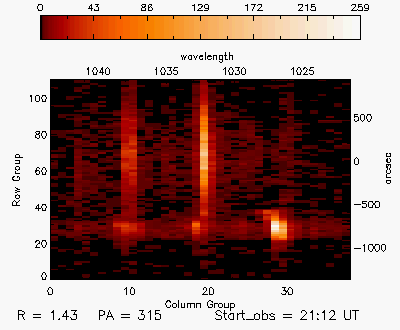
| 1998/11/07 21:12 | 362 | 1.43,1.73,2.01,2.30 |
HILya1216 HILyb1026 CIII977 OVI1032 OVI1038 |
|
| Images |
| UVCS Spectra Movie |
|
|
| Interpretation |
| Front | ? |
| Void | ? |
| Shock | ? |
| Current Sheet | No |
| Prominence | No |
| Flare O VI | No |
| Leg | ? |
| Helix | Yes |
| Comments |
Structured Doppler shifts
Last Update Thu Nov 20 17:00:05 2008