MOVIE of UVCS Slit on LASCO Images
CME 19980609
| Tutorials: UVCS CME Observations pdf / html | UVCS CME Catalog Pages html |
| Table 1 - General Information |
| CME ID |
Time (UT) |
PA (deg) |
Speed (km/sec) |
Acceleration (m/sec2) |
Mass (g) |
Type II RB |
X Flare |
| 19980609.082705.p090g |
08:27 |
87 |
189 |
-0.8* |
2.3e+14 |
No |
No |
| Table 2 - UVCS Observation Sequence |
| FITS filename |
PA (deg) |
T i (UT) |
Tf (UT) |
Height (Rsun) |
Slit W. (arcsec) |
Exp. Time (sec) |
| d98.06.09.09:34:34.lya.dat |
90 |
09:35:24 |
09:43:44 |
1.50 |
14 |
100 |
| 09:45:43 |
10:10:43 |
1.70 |
14 |
100 | ||
| 10:13:28 |
10:25:08 |
1.90 |
14 |
100 | ||
| 10:27:13 |
10:43:53 |
2.20 |
14 |
100 | ||
| 10:46:12 |
11:02:52 |
2.60 |
14 |
100 | ||
| 11:05:11 |
11:21:51 |
3.00 |
14 |
100 | ||
| d98.06.09.09:34:34.ovi.dat |
90 |
09:35:24 |
09:43:44 |
1.50 |
83 |
100 |
| 09:45:41 |
10:10:41 |
1.70 |
83 |
100 | ||
| 10:13:27 |
10:25:07 |
1.90 |
83 |
100 | ||
| 10:27:12 |
10:43:52 |
2.20 |
83 |
100 | ||
| 10:46:11 |
11:02:51 |
2.60 |
83 |
100 | ||
| 11:05:10 |
11:20:10 |
3.00 |
83 |
100 |
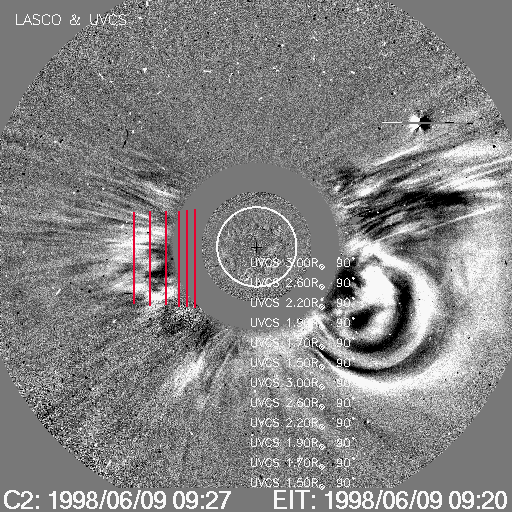
| UVCS Slit Position |
|
MOVIE of UVCS Slit on LASCO Images |
| Table 3 - UVCS Observation Wavelength Range |
| FITS filename |
Wave Min (A) |
Wave Max (A) |
| d98.06.09.09:34:34.lya.dat |
1210.40 |
1221.80 |
| 1205.50 |
1208.50 |
|
| 1195.00 |
1198.50 |
|
| d98.06.09.09:34:34.ovi.dat |
1022.70 |
1043.60 |
| 1005.40 |
1013.80 |
|
| 1235.40 |
1243.10 |
| Table 4 - UV Properties |
| First Obs. | Max blue-shift (km/sec) | Max red-shift (km/sec) | Detected at (Rsun) | Lines |
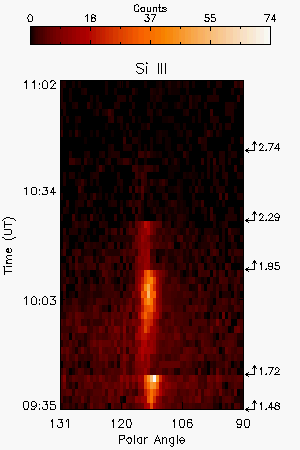
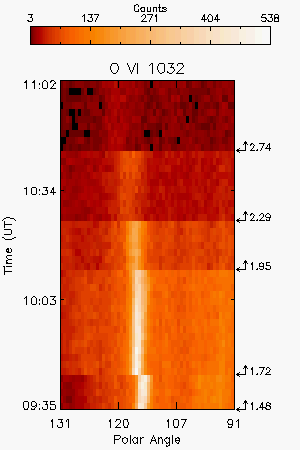
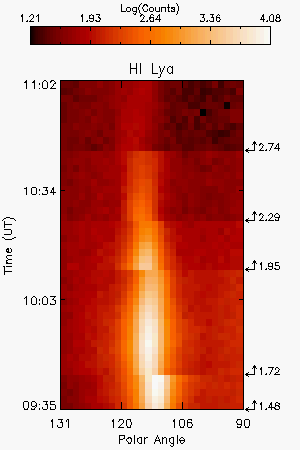
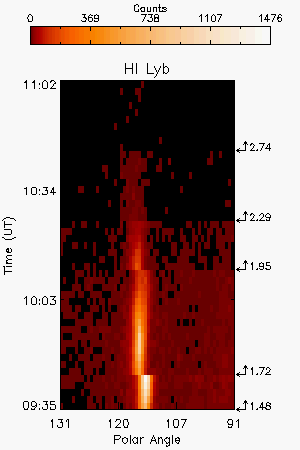
| 1998/06/09 09:35 | 50 | 1.48,1.72,1.95,2.29,2.74 |
HILya1216 HILyb1026 OVI1032 OVI1038 SiIII1207 |
|
| Images |
| Intensity Images |
||||||
| Interpretation |
| Front | No |
| Void | No |
| Shock | No |
| Current Sheet | ? |
| Prominence | ? |
| Flare O VI | No |
| Leg | No |
| Helix | No |
| Comments |
narrow blob (about 10 deg)
Last Update Mon Oct 6 13:27:53 2008