MOVIE of UVCS Slit on LASCO Images
CME 19980604
| Tutorials: UVCS CME Observations pdf / html | UVCS CME Catalog Pages html |
| Table 1 - General Information |
| CME ID |
Time (UT) |
PA (deg) |
Speed (km/sec) |
Acceleration (m/sec2) |
Mass (g) |
Type II RB |
X Flare |
| 19980604.063111.p055g |
06:31 |
45 |
805 |
13.7 |
1.4e+15 |
No |
No |
| Table 2 - UVCS Observation Sequence |
| FITS filename |
PA (deg) |
T i (UT) |
Tf (UT) |
Height (Rsun) |
Slit W. (arcsec) |
Exp. Time (sec) |
| d98.06.04.06:24:05.lya.dat |
360 |
06:24:54 |
06:39:54 |
1.50 |
14 |
300 |
| 06:41:46 |
07:06:46 |
1.75 |
14 |
300 | ||
| 07:08:47 |
07:43:47 |
2.00 |
14 |
300 | ||
| 07:45:52 |
08:30:52 |
2.25 |
14 |
300 | ||
| 08:33:13 |
09:33:13 |
2.50 |
14 |
300 | ||
| d98.06.04.06:24:05.ovi.dat |
360 |
06:24:54 |
06:39:54 |
1.50 |
83 |
300 |
| 06:41:45 |
07:06:45 |
1.75 |
83 |
300 | ||
| 07:08:46 |
07:43:46 |
2.00 |
83 |
300 | ||
| 07:45:52 |
08:30:52 |
2.25 |
83 |
300 | ||
| 08:33:12 |
09:33:12 |
2.50 |
83 |
300 |
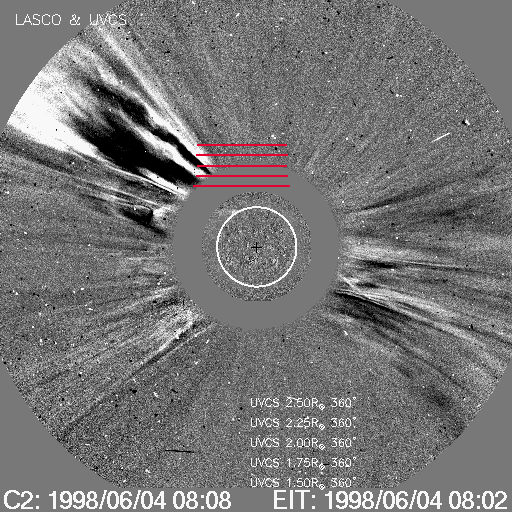
| UVCS Slit Position |
|
MOVIE of UVCS Slit on LASCO Images |
| Table 3 - UVCS Observation Wavelength Range |
| FITS filename |
Wave Min (A) |
Wave Max (A) |
| d98.06.04.06:24:05.lya.dat |
1210.40 |
1221.80 |
| 1205.50 |
1208.50 |
|
| 1195.00 |
1198.50 |
|
| d98.06.04.06:24:05.ovi.dat |
1022.70 |
1043.60 |
| 1005.40 |
1013.80 |
|
| 1235.40 |
1243.10 |
| Table 4 - UV Properties |
| First Obs. | Max blue-shift (km/sec) | Max red-shift (km/sec) | Detected at (Rsun) | Lines |
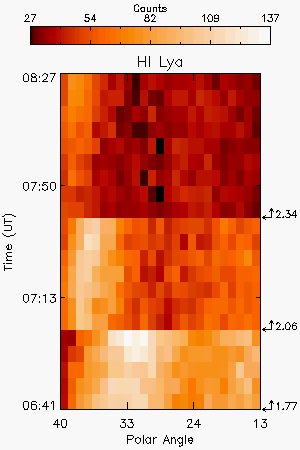
| 1997/06/04 06:57 | 1.77, 2.06, 2.34 |
HILya1216 OVI1032 OVI1038 | ||
| Images |
| Intensity Images |
|||
| Interpretation |
| Front | No |
| Void | No |
| Shock | No |
| Current Sheet | No |
| Prominence | No |
| Flare O VI | No |
| Leg | ? |
| Helix | No |
| Comments |
small intensity variations
Last Update Fri Sep 26 12:16:06 2008