MOVIE of UVCS Slit on LASCO Images
CME 19980511
| Tutorials: UVCS CME Observations pdf / html | UVCS CME Catalog Pages html |
| Table 1 - General Information |
| CME ID |
Time (UT) |
PA (deg) |
Speed (km/sec) |
Acceleration (m/sec2) |
Mass (g) |
Type II RB |
X Flare |
| 19980511.215522.p284g |
21:55 |
208 |
830 |
-4.7 |
1.0e+16* |
No |
Yes |
| Table 2 - UVCS Observation Sequence |
| FITS filename |
PA (deg) |
T i (UT) |
Tf (UT) |
Height (Rsun) |
Slit W. (arcsec) |
Exp. Time (sec) |
| d98.05.11.20:28:17.lya.dat |
180 |
20:29:11 |
22:59:11 |
1.90 |
14 |
300 |
| 23:11:25 |
23:41:25 |
1.88 |
14 |
300 | ||
| 23:44:43 |
02:14:43 |
2.10 |
14 |
300 | ||
| 02:26:45 |
02:56:45 |
2.08 |
14 |
300 | ||
| d98.05.12.03:28:09.lya.dat |
270 |
03:28:58 |
03:37:18 |
1.50 |
14 |
100 |
| 03:39:18 |
04:04:18 |
1.70 |
14 |
100 | ||
| 04:07:07 |
04:18:47 |
1.90 |
14 |
100 | ||
| 04:20:52 |
04:37:32 |
2.20 |
14 |
100 | ||
| 04:39:59 |
04:56:39 |
2.60 |
14 |
100 | ||
| 04:58:59 |
05:15:39 |
3.00 |
14 |
100 | ||
| d98.05.11.20:28:17.ovi.dat |
180 |
20:29:09 |
22:59:09 |
1.90 |
38 |
300 |
| 23:11:24 |
23:41:24 |
1.88 |
38 |
300 | ||
| 23:44:41 |
02:14:41 |
2.10 |
38 |
300 | ||
| 02:26:45 |
02:56:45 |
2.08 |
38 |
300 | ||
| d98.05.12.03:28:09.ovi.dat |
270 |
03:28:58 |
03:37:18 |
1.50 |
82 |
100 |
| 03:39:17 |
04:04:17 |
1.70 |
82 |
100 | ||
| 04:07:07 |
04:18:47 |
1.90 |
82 |
100 | ||
| 04:20:52 |
04:37:32 |
2.20 |
82 |
100 | ||
| 04:39:57 |
04:56:37 |
2.60 |
82 |
100 | ||
| 04:58:58 |
05:15:38 |
3.00 |
82 |
100 |
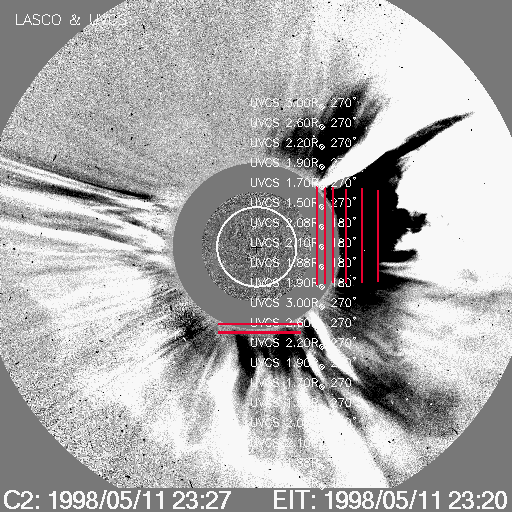
| UVCS Slit Position |
|
MOVIE of UVCS Slit on LASCO Images |
| Table 3 - UVCS Observation Wavelength Range |
| FITS filename |
Wave Min (A) |
Wave Max (A) |
| d98.05.11.20:28:17.lya.dat |
1194.80 |
1283.00 |
| d98.05.12.03:28:09.lya.dat |
1210.40 |
1221.70 |
| 1205.50 |
1208.50 |
|
| 1195.00 |
1198.50 |
|
| d98.05.11.20:28:17.ovi.dat |
1023.30 |
1045.90 |
| 997.600 |
1023.20 |
|
| 954.100 |
979.800 |
|
| 1176.40 |
1200.10 |
|
| d98.05.12.03:28:09.ovi.dat |
1022.70 |
1043.60 |
| 1005.40 |
1013.80 |
|
| 1235.40 |
1243.10 |
| Table 4 - UV Properties |
| First Obs. | Max blue-shift (km/sec) | Max red-shift (km/sec) | Detected at (Rsun) | Lines |
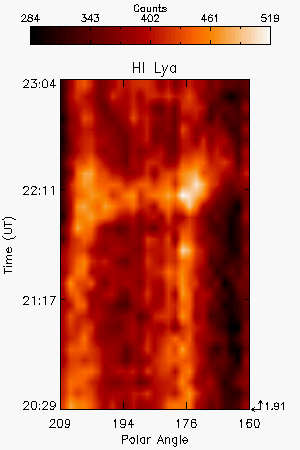
| 1998/05/11 21:22 | 50 | 1.91, 1.48, 1.72, 1.95, 2.29, 2.74 |
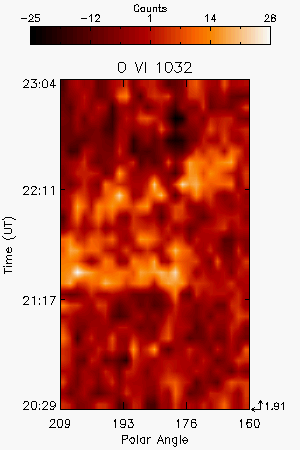
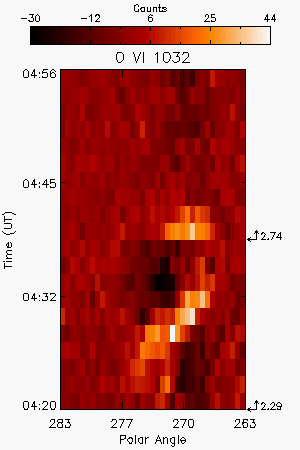
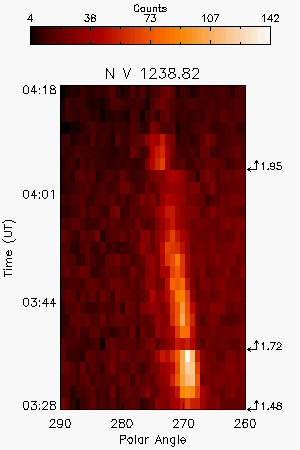
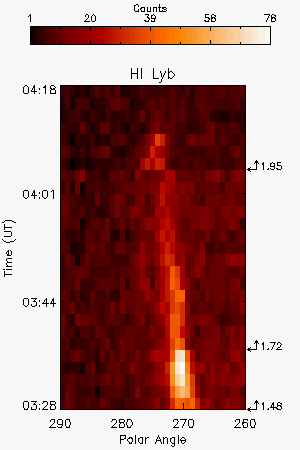
HILya1216 OVI1032 OVI1038 NV1243 SiIII1207 NV1239 | |
| Images |
| Intensity Images |
|||||||||
| Interpretation |
| Front | ? |
| Void | ? |
| Shock | No |
| Current Sheet | ? |
| Prominence | ? |
| Flare O VI | Yes |
| Leg | No |
| Helix | ? |
| Comments |
Narrow feature at the West limb 5 hours after the first CME detection by LASCO. The LASCO central polar angle is likely incorrect
Last Update Tue Dec 9 23:37:09 2008