MOVIE of UVCS Slit on LASCO Images
CME 19980407
| Tutorials: UVCS CME Observations pdf / html | UVCS CME Catalog Pages html |
| Table 1 - General Information |
| CME ID |
Time (UT) |
PA (deg) |
Speed (km/sec) |
Acceleration (m/sec2) |
Mass (g) |
Type II RB |
X Flare |
| 19980407.101419.p100g |
10:14 |
90 |
395 |
-20.4* |
5.9e+13* |
No |
No |
| Table 2 - UVCS Observation Sequence |
| FITS filename |
PA (deg) |
T i (UT) |
Tf (UT) |
Height (Rsun) |
Slit W. (arcsec) |
Exp. Time (sec) |
| d98.04.07.05:44:30.lya.dat |
120 |
07:32:40 |
10:02:40 |
1.65 |
13 |
200 |
| 10:11:03 |
14:04:23 |
1.70 |
13 |
200 | ||
| d98.04.07.05:44:30.ovi.dat |
120 |
07:32:38 |
10:02:38 |
1.65 |
14 |
200 |
| 10:11:01 |
14:04:21 |
1.70 |
14 |
200 |
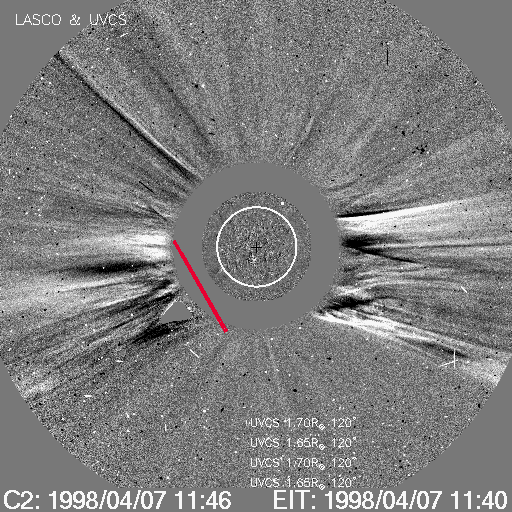
| UVCS Slit Position |
|
MOVIE of UVCS Slit on LASCO Images |
| Table 3 - UVCS Observation Wavelength Range |
| FITS filename |
Wave Min (A) |
Wave Max (A) |
| d98.04.07.05:44:30.lya.dat |
1142.30 |
1285.70 |
| d98.04.07.05:44:30.ovi.dat |
942.300 |
1042.60 |
| 1099.20 |
1191.60 |
| Table 4 - UV Properties |
| Max blue-shift (km/sec) | Max red-shift (km/sec) | Detected at (Rsun) | Lines |
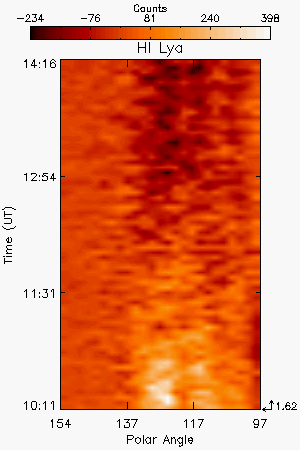
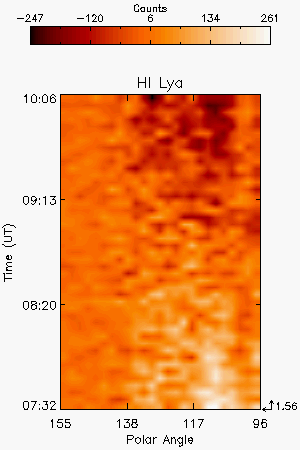
| 1.56, 1.62 |
HILya1216 OVI1032 OVI1038 | ||
| Images |
| Intensity Images |
|||||
| Interpretation |
| Front | No |
| Void | No |
| Shock | No |
| Current Sheet | No |
| Prominence | No |
| Flare O VI | No |
| Leg | No |
| Helix | No |
| Comments |
Faint variations in HI Ly-alpha and OVI lines not clearly related to the LASCO event (out of CME angular width) may be associated with the next LASCO event (19980407.121835.p091s)
Last Update Mon Aug 11 15:22:19 2008