MOVIE of UVCS Slit on LASCO Images
CME 19980331
| Tutorials: UVCS CME Observations pdf / html | UVCS CME Catalog Pages html |
| Table 1 - General Information |
| CME ID |
Time (UT) |
PA (deg) |
Speed (km/sec) |
Acceleration (m/sec2) |
Mass (g) |
Type II RB |
X Flare |
| 19980331.155448.p157g |
15:54 |
158 |
1047 |
7.9 |
4.2e+14 |
No |
No |
| Table 2 - UVCS Observation Sequence |
| FITS filename |
PA (deg) |
T i (UT) |
Tf (UT) |
Height (Rsun) |
Slit W. (arcsec) |
Exp. Time (sec) |
| d98.03.31.12:46:31.ovi.dat |
180 |
14:55:46 |
15:55:46 |
2.50 |
49 |
300 |
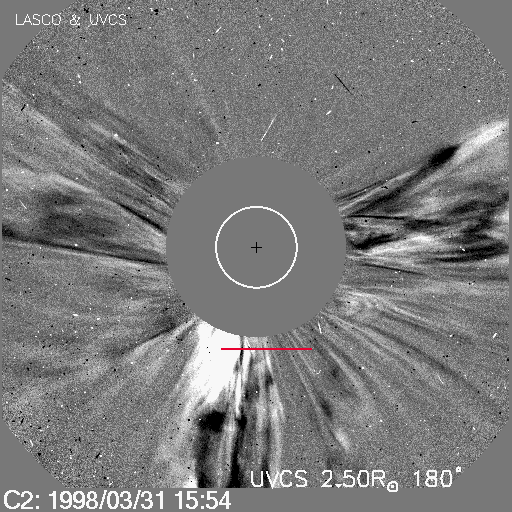
| UVCS Slit Position |
|
MOVIE of UVCS Slit on LASCO Images |
| Table 3 - UVCS Observation Wavelength Range |
| FITS filename |
Wave Min (A) |
Wave Max (A) |
| d98.03.31.12:46:31.ovi.dat |
1022.70 |
1043.60 |
| 1005.40 |
1013.80 |
|
| 1235.40 |
1243.10 |
| Table 4 - UV Properties |
| First Obs. | Max blue-shift (km/sec) | Max red-shift (km/sec) | Detected at (Rsun) | Lines |
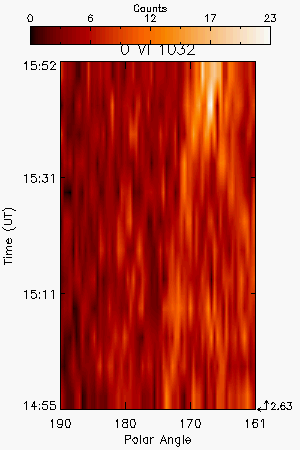
| 1998/03/31 14:55 | 2.63 Rsun |
OVI1032 | ||
| Images |
| Intensity Images |
||
| Interpretation |
| Front | No |
| Void | No |
| Shock | No |
| Current Sheet | No |
| Prominence | No |
| Flare O VI | No |
| Leg | Yes |
| Helix | No |
| Comments |
Only few exposures at the beginning of the CME, no CME signal in HI Ly-alpha
Last Update Fri Aug 8 12:50:27 2008