MOVIE of UVCS Slit on LASCO Images
CME 19980321
| Tutorials: UVCS CME Observations pdf / html | UVCS CME Catalog Pages html |
| Table 1 - General Information |
| CME ID |
Time (UT) |
PA (deg) |
Speed (km/sec) |
Acceleration (m/sec2) |
Mass (g) |
Type II RB |
X Flare |
| 19980321.061122.p251g |
06:11 |
238 |
239 |
------ |
1.2e+14 |
No |
Yes |
| Table 2 - UVCS Observation Sequence |
| FITS filename |
PA (deg) |
T i (UT) |
Tf (UT) |
Height (Rsun) |
Slit W. (arcsec) |
Exp. Time (sec) |
| d98.03.21.14:48:04.lya.dat |
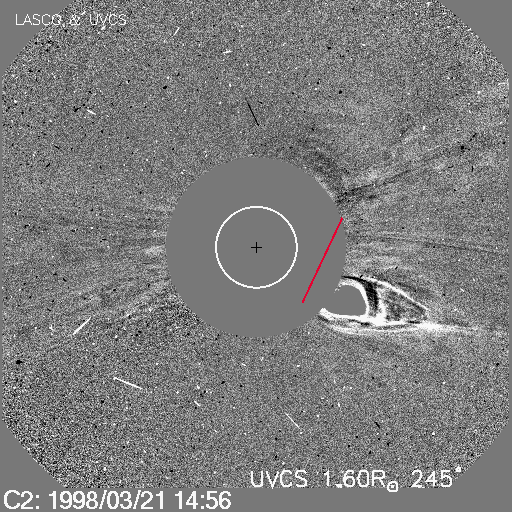
245 |
14:52:04 |
23:48:44 |
1.60 |
14 |
200 |
| d98.03.21.14:48:04.ovi.dat |
245 |
14:52:04 |
23:52:04 |
1.60 |
14 |
200 |
| UVCS Slit Position |
|
MOVIE of UVCS Slit on LASCO Images |
| Table 3 - UVCS Observation Wavelength Range |
| FITS filename |
Wave Min (A) |
Wave Max (A) |
| d98.03.21.14:48:04.lya.dat |
1234.90 |
1246.10 |
| 1211.20 |
1220.60 |
|
| 1204.70 |
1208.40 |
|
| 1194.10 |
1198.90 |
|
| 1173.50 |
1178.40 |
|
| d98.03.21.14:48:04.ovi.dat |
1018.60 |
1040.10 |
| 996.700 |
1012.40 |
|
| 987.800 |
994.100 |
|
| 970.800 |
979.500 |
|
| 943.300 |
952.200 |
|
| 1182.50 |
1190.70 |
| Table 4 - UV Properties |
| Max blue-shift (km/sec) | Max red-shift (km/sec) | Detected at (Rsun) | Lines |
| 1.49 |
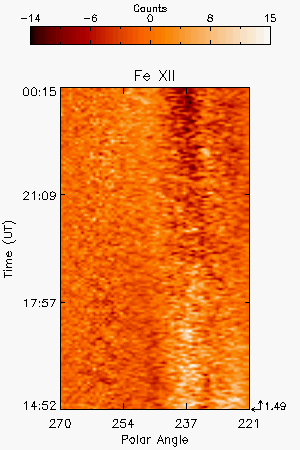
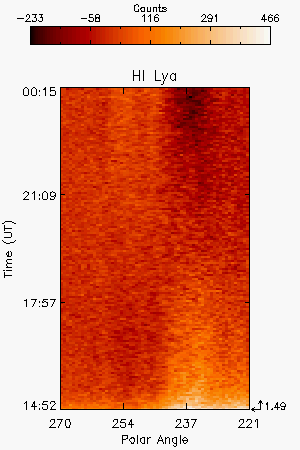
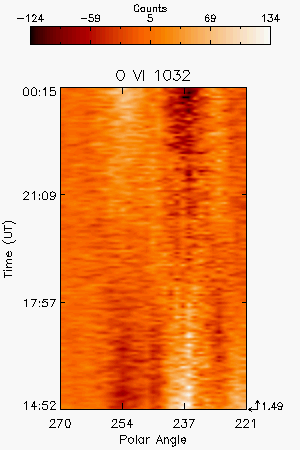
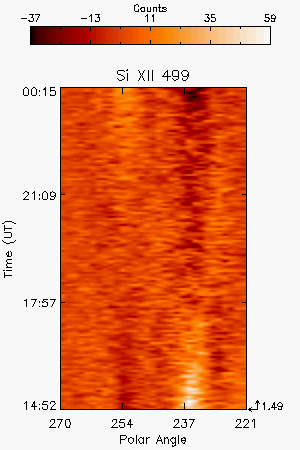
HILya1216 HILyb1026 OVI1032 OVI1038 SiXII499 FeXII1242 | ||
| Images |
| Intensity Images |
|||||
| Interpretation |
| Front | No |
| Void | No |
| Shock | No |
| Current Sheet | No |
| Prominence | No |
| Flare O VI | No |
| Leg | No |
| Helix | No |
| Comments |
faint and slow variation of spectral line intensity
Last Update Thu Aug 7 18:37:01 2008