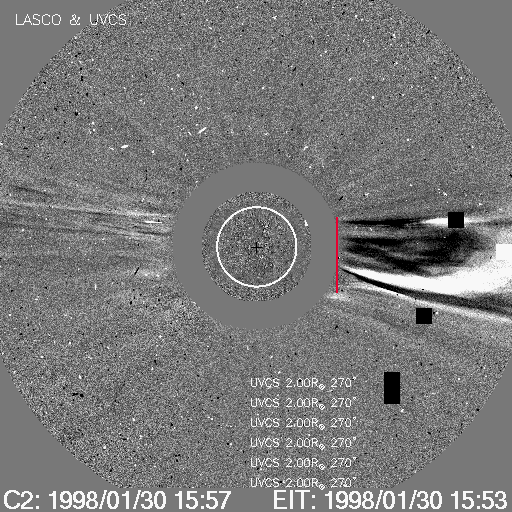
MOVIE of UVCS Slit on LASCO Images
CME 19980130
| Tutorials: UVCS CME Observations pdf / html | UVCS CME Catalog Pages html |
| Table 1 - General Information |
| CME ID |
Time (UT) |
PA (deg) |
Speed (km/sec) |
Acceleration (m/sec2) |
Mass (g) |
Type II RB |
X Flare |
| 19980130.143103.p268g |
14:31 |
269 |
443 |
-3.2 |
4.8e+14 |
No |
No |
| Table 2 - UVCS Observation Sequence |
| FITS filename |
PA (deg) |
T i (UT) |
Tf (UT) |
Height (Rsun) |
Slit W. (arcsec) |
Exp. Time (sec) |
| d98.01.30.15:35:44.lya.dat |
270 |
15:36:02 |
16:16:02 |
2.00 |
14 |
200 |
| 16:22:26 |
16:42:26 |
2.00 |
4 |
200 | ||
| 16:46:55 |
00:56:55 |
2.00 |
14 |
200 | ||
| d98.01.30.15:35:44.ovi.dat |
270 |
15:36:02 |
16:16:02 |
2.00 |
9 |
200 |
| 16:22:24 |
16:42:24 |
2.00 |
9 |
200 | ||
| 16:46:53 |
00:56:53 |
2.00 |
9 |
200 |
| UVCS Slit Position |
|
MOVIE of UVCS Slit on LASCO Images |
| Table 3 - UVCS Observation Wavelength Range |
| FITS filename |
Wave Min (A) |
Wave Max (A) |
| d98.01.30.15:35:44.lya.dat |
1237.10 |
1246.60 |
| 1204.20 |
1233.60 |
|
| 1194.10 |
1200.00 |
|
| d98.01.30.15:35:44.ovi.dat |
1023.30 |
1043.80 |
| 997.700 |
1000.40 |
|
| 975.400 |
978.300 |
|
| 971.300 |
974.300 |
|
| 1188.20 |
1190.90 |
|
| 966.800 |
969.000 |
| Table 4 - UV Properties |
| Max blue-shift (km/sec) | Max red-shift (km/sec) | Detected at (Rsun) | Lines |
| 2.00 |
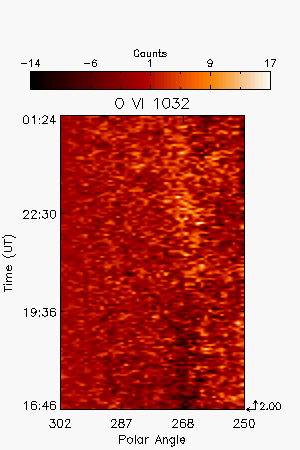
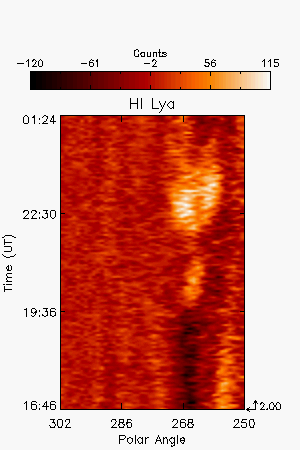
HILya1216 OVI1032 OVI1038 | ||
| Images |
| Intensity Images |
|||
| Interpretation |
| Front | No |
| Void | No |
| Shock | No |
| Current Sheet | No |
| Prominence | No |
| Flare O VI | No |
| Leg | No |
| Helix | No |
| Comments |
UV lines variation appears quite late with respect to the LASCO detection of the CME front
Last Update Wed Aug 6 12:03:39 2008