CME 20050329
| Tutorials: UVCS CME Observations pdf / html | UVCS CME Catalog Pages html |
| Table 1 - General Information |
| CME ID |
Time (UT) |
PA (deg) |
Speed (km/sec) |
Acceleration (m/sec2) |
Mass (g) |
Type II RB |
X Flare |
| 20050329.143605.p262g |
14:36 |
261 |
533 |
------ |
------- |
No |
No |
| Table 2 - UVCS Observation Sequence |
| FITS filename |
PA (deg) |
T i (UT) |
Tf (UT) |
Height (Rsun) |
Slit W. (arcsec) |
Exp. Time (sec) |
| s05.03.29.15:11:44.ovi.dat |
270 |
15:12:37 |
16:14:37 |
3.02 |
55 |
120 |
| 16:19:17 |
16:35:17 |
2.21 |
55 |
120 | ||
| 16:36:21 |
16:42:21 |
2.03 |
55 |
120 | ||
| 16:43:05 |
16:51:05 |
1.91 |
55 |
120 | ||
| 16:51:53 |
16:55:53 |
1.79 |
55 |
120 | ||
| s05.03.29.16:57:27.ovi.dat |
270 |
16:58:20 |
17:08:20 |
3.00 |
41 |
120 |
| 17:09:12 |
17:17:12 |
2.58 |
41 |
120 | ||
| 17:18:00 |
17:24:00 |
2.19 |
41 |
120 | ||
| 17:24:44 |
17:28:44 |
2.01 |
41 |
120 | ||
| 17:29:24 |
17:33:24 |
1.89 |
41 |
120 | ||
| 17:34:04 |
17:38:04 |
1.77 |
41 |
120 |
| Table 3 - UVCS Observation Wavelength Range |
| FITS filename |
Wave Min (A) |
Wave Max (A) |
| s05.03.29.15:11:44.ovi.dat |
1022.90 |
1044.70 |
| 972.800 |
981.500 |
|
| s05.03.29.16:57:27.ovi.dat |
986.200 |
1001.40 |
| 1204.90 |
1219.00 |
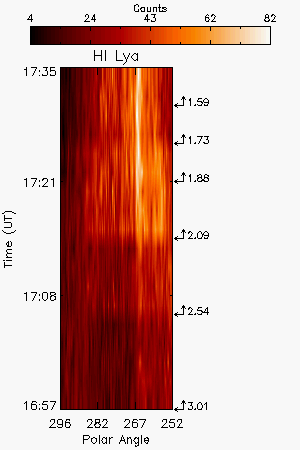
| Table 4 - UV Properties |
| First Obs. | Max blue-shift (km/sec) | Max red-shift (km/sec) | Detected at (Rsun) | Lines |
| 2005/03/29 17:54 | 3,0,2,54,2.09,1.88,1.73 |
HILya1216 OVI1032 OVI1038 | ||
| Images |
| Intensity Images |
|||
| Interpretation |
| Front | No |
| Void | No |
| Shock | No |
| Current Sheet | No |
| Prominence | Yes |
| Flare O VI | No |
| Leg | No |
| Helix | No |
| Comments |
narrow ejecta
Last Update Wed May 13 23:35:38 2009