MOVIE of UVCS Slit on LASCO Images
CME 20030528
| Tutorials: UVCS CME Observations pdf / html | UVCS CME Catalog Pages html |
| Table 1 - General Information |
| CME ID |
Time (UT) |
PA (deg) |
Speed (km/sec) |
Acceleration (m/sec2) |
Mass (g) |
Type II RB |
X Flare |
| 20030528.005005.p292g |
00:50 |
Halo |
1366 |
25.9* |
1.3e+16* |
Yes |
Yes |
| Table 2 - UVCS Observation Sequence |
| FITS filename |
PA (deg) |
T i (UT) |
Tf (UT) |
Height (Rsun) |
Slit W. (arcsec) |
Exp. Time (sec) |
| d03.05.27.16:50:43.ovi.dat |
360 |
23:14:53 |
03:09:53 |
1.80 |
27 |
300 |
| UVCS Slit Position |
|
MOVIE of UVCS Slit on LASCO Images |
| Table 3 - UVCS Observation Wavelength Range |
| FITS filename |
Wave Min (A) |
Wave Max (A) |
| d03.05.27.16:50:43.ovi.dat |
1029.50 |
1039.70 |
| 1024.20 |
1027.40 |
|
| 966.600 |
974.200 |
|
| 1209.10 |
1216.10 |
| Table 4 - UV Properties |
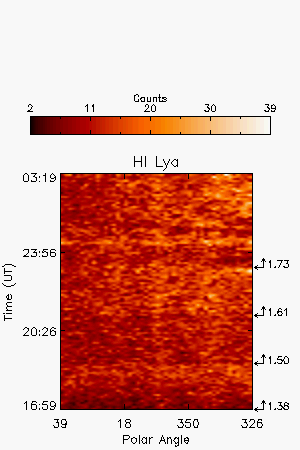
| First Obs. | Max blue-shift (km/sec) | Max red-shift (km/sec) | Detected at (Rsun) | Lines |
| 2003/05/27 22:58 | 1.71,1.61 |
HILya1216 OVI1032 | ||
| Images |
| Intensity Images |
||
| Interpretation |
| Front | No |
| Void | No |
| Shock | No |
| Current Sheet | No |
| Prominence | No |
| Flare O VI | No |
| Leg | No |
| Helix | No |
| Comments |
High background is detected from 00:21 to 00:37 at the time the X-ray flare occurred. X-ray artifact (exposures 84,85,86) in H I Lya line. Bad telemetry in exposure 22.
Last Update Tue May 12 04:11:17 2009