MOVIE of UVCS Slit on LASCO Images
CME 20030527
| Tutorials: UVCS CME Observations pdf / html | UVCS CME Catalog Pages html |
| Table 1 - General Information |
| CME ID |
Time (UT) |
PA (deg) |
Speed (km/sec) |
Acceleration (m/sec2) |
Mass (g) |
Type II RB |
X Flare |
| 20030527.060605.p079g |
06:06 |
91 |
725 |
-8.9 |
7.4e+13 |
Yes |
Yes |
| Table 2 - UVCS Observation Sequence |
| FITS filename |
PA (deg) |
T i (UT) |
Tf (UT) |
Height (Rsun) |
Slit W. (arcsec) |
Exp. Time (sec) |
| d03.05.27.06:50:02.ovi.dat |
76 |
06:50:24 |
08:38:24 |
1.72 |
27 |
120 |
| d03.05.27.08:48:27.ovi.dat |
76 |
08:48:49 |
11:28:49 |
1.75 |
27 |
120 |
| UVCS Slit Position |
|
MOVIE of UVCS Slit on LASCO Images |
| Table 3 - UVCS Observation Wavelength Range |
| FITS filename |
Wave Min (A) |
Wave Max (A) |
| d03.05.27.06:50:02.ovi.dat |
1022.20 |
1043.60 |
| 996.100 |
1001.00 |
|
| 974.500 |
988.000 |
|
| 1209.90 |
1222.30 |
|
| d03.05.27.08:48:27.ovi.dat |
1024.00 |
1043.20 |
| 1005.00 |
1013.10 |
|
| 998.100 |
1002.00 |
|
| 967.200 |
981.100 |
|
| 943.400 |
966.300 |
|
| 1170.70 |
1191.90 |
| Table 4 - UV Properties |
| First Obs. | Max blue-shift (km/sec) | Max red-shift (km/sec) | Detected at (Rsun) | Lines |
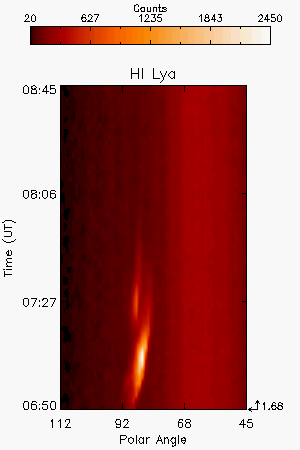
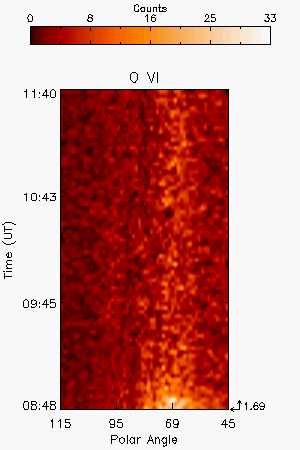
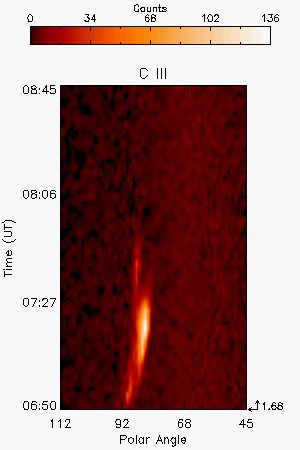
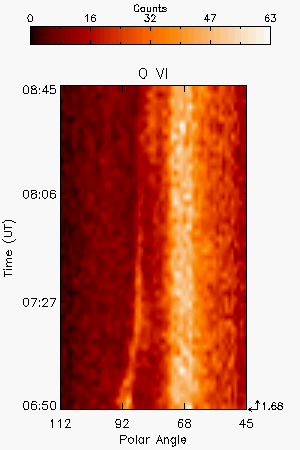
| 2002/05/27 08:38 | 45 | 90 | 1.69 |
HILya1216 HILyb1026 CIII977 OVI1032 OVI1038 |
| Images |
| Intensity Images |
|||||
| Interpretation |
| Front | No |
| Void | No |
| Shock | No |
| Current Sheet | No |
| Prominence | Yes |
| Flare O VI | No |
| Leg | No |
| Helix | No |
| Comments |
The spectra of the second FITS file show brightening of the OVI lines most probably due to the brightening of post flare loops
Last Update Fri Apr 17 21:44:07 2009