MOVIE of UVCS Slit on LASCO Images
CME 20030526
| Tutorials: UVCS CME Observations pdf / html | UVCS CME Catalog Pages html |
| Table 1 - General Information |
| CME ID |
Time (UT) |
PA (deg) |
Speed (km/sec) |
Acceleration (m/sec2) |
Mass (g) |
Type II RB |
X Flare |
| 20030526.165005.p084g |
16:50 |
95 |
762 |
-22.5 |
2.5e+14 |
No |
Yes |
| Table 2 - UVCS Observation Sequence |
| FITS filename |
PA (deg) |
T i (UT) |
Tf (UT) |
Height (Rsun) |
Slit W. (arcsec) |
Exp. Time (sec) |
| d03.05.26.16:52:27.ovi.dat |
75 |
16:52:49 |
18:40:49 |
1.72 |
27 |
120 |
| d03.05.26.18:50:53.ovi.dat |
75 |
18:51:15 |
21:31:15 |
1.75 |
27 |
120 |
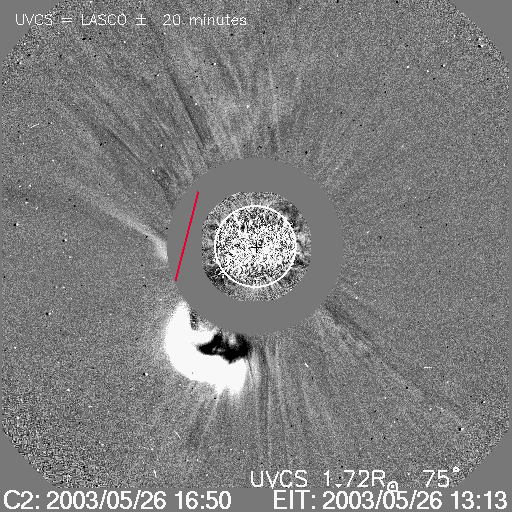
| UVCS Slit Position |
|
MOVIE of UVCS Slit on LASCO Images |
| Table 3 - UVCS Observation Wavelength Range |
| FITS filename |
Wave Min (A) |
Wave Max (A) |
| d03.05.26.16:52:27.ovi.dat |
1022.20 |
1043.60 |
| 996.100 |
1001.00 |
|
| 974.500 |
988.000 |
|
| 1209.90 |
1222.30 |
|
| d03.05.26.18:50:53.ovi.dat |
1024.00 |
1043.20 |
| 1005.00 |
1013.10 |
|
| 998.000 |
1002.00 |
|
| 967.200 |
981.100 |
|
| 943.400 |
966.300 |
|
| 1170.70 |
1191.90 |
| Table 4 - UV Properties |
| First Obs. | Max blue-shift (km/sec) | Max red-shift (km/sec) | Detected at (Rsun) | Lines |
| 2003/05/26 17:18 | 1.68,1.69 |
HILya1216 CIII977 OVI1032 OVI1038 | ||
| Images |
| Intensity Images |
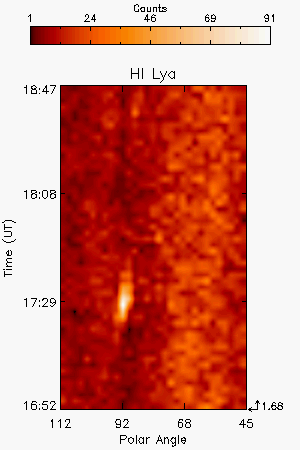
H I Lya 1216A intensity image. The Lya line is present just in the first FITS file. |
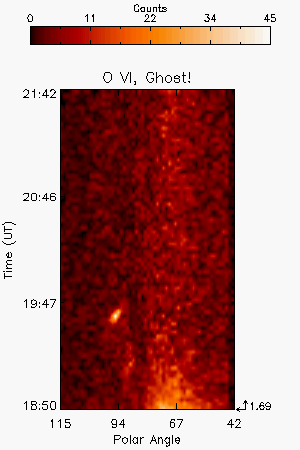
O VI 1032A intensity image. In the first set of data no significant O VI changes are detected. |
||
| Interpretation |
| Front | No |
| Void | No |
| Shock | No |
| Current Sheet | No |
| Prominence | Yes |
| Flare O VI | ? |
| Leg | No |
| Helix | No |
| Comments |
In the second FITS file, brightening of the O VI lines is detected at the beginnig of the observation. It maybe due to the brightening of the post-CME loops
Last Update Fri Apr 17 22:21:47 2009