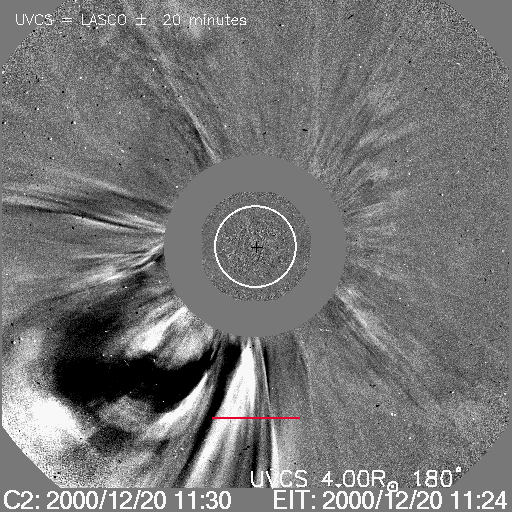
MOVIE of UVCS Slit on LASCO Images
CME 20001220
| Tutorials: UVCS CME Observations pdf / html | UVCS CME Catalog Pages html |
| Table 1 - General Information |
| CME ID |
Time (UT) |
PA (deg) |
Speed (km/sec) |
Acceleration (m/sec2) |
Mass (g) |
Type II RB |
X Flare |
| 20001220.103005.p132g |
10:30 |
127 |
1076 |
-2.8 |
1.5e+15* |
No |
No |
| Table 2 - UVCS Observation Sequence |
| FITS filename |
PA (deg) |
T i (UT) |
Tf (UT) |
Height (Rsun) |
Slit W. (arcsec) |
Exp. Time (sec) |
| s00.12.20.09:22:08.ovi.dat |
180 |
09:23:01 |
10:43:01 |
4.00 |
41 |
120 |
| s00.12.20.10:50:15.ovi.dat |
180 |
10:51:08 |
12:11:08 |
4.00 |
41 |
120 |
| s00.12.20.12:18:26.ovi.dat |
180 |
12:19:19 |
12:47:19 |
3.50 |
41 |
120 |
| 12:51:06 |
13:15:06 |
3.00 |
41 |
120 | ||
| 13:18:48 |
13:42:48 |
2.50 |
41 |
120 | ||
| 13:46:31 |
14:00:31 |
2.10 |
41 |
120 | ||
| 14:03:47 |
14:13:47 |
1.90 |
41 |
120 | ||
| 14:16:32 |
14:24:32 |
1.75 |
41 |
120 | ||
| 14:26:33 |
14:30:33 |
1.60 |
41 |
120 |
| UVCS Slit Position |
|
MOVIE of UVCS Slit on LASCO Images |
| Table 3 - UVCS Observation Wavelength Range |
| FITS filename |
Wave Min (A) |
Wave Max (A) |
| s00.12.20.09:22:08.ovi.dat |
1024.50 |
1042.70 |
| 966.600 |
978.900 |
|
| 1204.70 |
1216.00 |
|
| s00.12.20.10:50:15.ovi.dat |
1024.50 |
1042.70 |
| 966.600 |
978.900 |
|
| 1204.70 |
1216.00 |
|
| s00.12.20.12:18:26.ovi.dat |
1024.50 |
1042.70 |
| 966.600 |
978.900 |
|
| 1204.70 |
1216.00 |
| Table 4 - UV Properties |
| First Obs. | Max blue-shift (km/sec) | Max red-shift (km/sec) | Detected at (Rsun) | Lines |
| 2000/12/20 11:27 |
| |||
| Images |
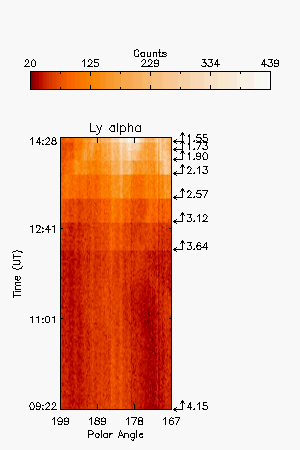
| Intensity Images |
||
| Interpretation |
| Front | Yes |
| Void | No |
| Shock | No |
| Current Sheet | No |
| Prominence | ? |
| Flare O VI | No |
| Leg | No |
| Helix | No |
| Comments |
Ly alpha displacement starting at top of slit at 5.15 Rsun
Last Update Wed May 7 17:09:31 2008