MOVIE of UVCS Slit on LASCO Images
CME 19990423
| Tutorials: UVCS CME Observations pdf / html | UVCS CME Catalog Pages html |
| Table 1 - General Information |
| CME ID |
Time (UT) |
PA (deg) |
Speed (km/sec) |
Acceleration (m/sec2) |
Mass (g) |
Type II RB |
X Flare |
| 19990423.015407.p267s |
01:54 |
254 |
523 |
25.4 |
2.7e+15 |
No |
No |
| Table 2 - UVCS Observation Sequence |
| FITS filename |
PA (deg) |
T i (UT) |
Tf (UT) |
Height (Rsun) |
Slit W. (arcsec) |
Exp. Time (sec) |
| d99.04.23.00:27:11.ovi.dat |
270 |
01:04:25 |
01:16:25 |
2.00 |
28 |
180 |
| 01:18:38 |
01:33:38 |
2.30 |
28 |
180 | ||
| 01:36:41 |
02:02:01 |
2.80 |
28 |
200 | ||
| 02:04:49 |
02:39:29 |
3.50 |
28 |
200 |
| UVCS Slit Position |
|
MOVIE of UVCS Slit on LASCO Images |
| Table 3 - UVCS Observation Wavelength Range |
| FITS filename |
Wave Min (A) |
Wave Max (A) |
| d99.04.23.00:27:11.ovi.dat |
1023.20 |
1043.80 |
| 980.400 |
993.400 |
|
| 1208.70 |
1220.60 |
|
| 975.800 |
979.200 |
|
| 1221.80 |
1224.90 |
| Table 4 - UV Properties |
| First Obs. | Max blue-shift (km/sec) | Max red-shift (km/sec) | Detected at (Rsun) | Lines |
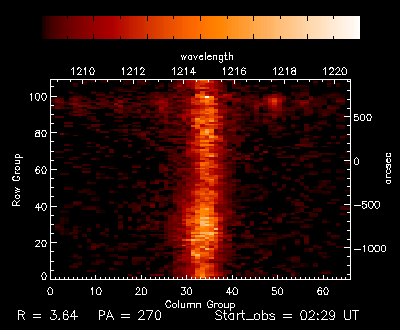
| 1999/04/23 02:25 | 0 | 173 | 3.64 |
HILya1216 HILyb1026 CIII977 OVI1032 OVI1038 NIII990 NIII992 OV1214 OV1218 |
| Images |
| Intensity Images |
Loop structure can also be seen in the LASCO/C2 WL image at 02:30 UT. |
||
| Plots and more |
Lines seen: LyA, O V] 1218.4, [O V] 1213.9, N III 991.6/989.8 |
|
| Interpretation |
| Front | ? |
| Void | No |
| Shock | ? |
| Current Sheet | No |
| Prominence | Yes |
| Flare O VI | No |
| Leg | ? |
| Helix | No |
| Publications |
Akmal et al. 2001, ApJ, 553, 922
| Comments |
LyA profile at PA=~280deg seems to broaden. It is not clear if it is due to the front (or maybe shock at CME front) or just bright leg material.
Last Update Fri May 9 15:07:37 2008