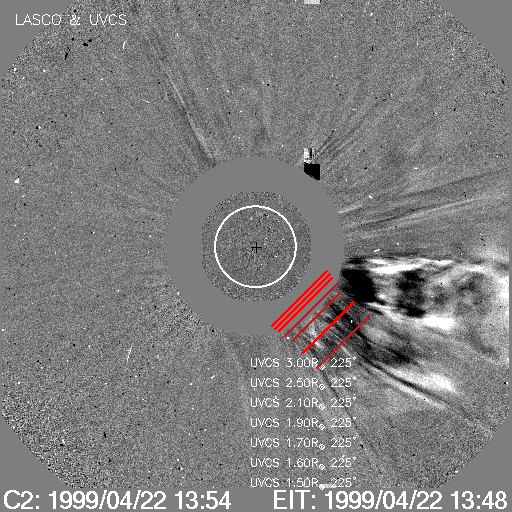
MOVIE of UVCS Slit on LASCO Images
CME 19990422
| Tutorials: UVCS CME Observations pdf / html | UVCS CME Catalog Pages html |
| Table 1 - General Information |
| CME ID |
Time (UT) |
PA (deg) |
Speed (km/sec) |
Acceleration (m/sec2) |
Mass (g) |
Type II RB |
X Flare |
| 19990422.123006.p258s |
12:30 |
236 |
565 |
-21.6* |
3.6e+14 |
No |
No |
| Table 2 - UVCS Observation Sequence |
| FITS filename |
PA (deg) |
T i (UT) |
Tf (UT) |
Height (Rsun) |
Slit W. (arcsec) |
Exp. Time (sec) |
| d99.04.22.13:07:28.ovi.dat |
225 |
13:08:21 |
13:15:01 |
1.50 |
27 |
200 |
| 13:15:45 |
13:22:25 |
1.60 |
27 |
200 | ||
| 13:23:15 |
13:32:15 |
1.70 |
27 |
180 | ||
| 13:34:20 |
13:43:20 |
1.90 |
27 |
180 | ||
| 13:45:19 |
13:57:19 |
2.10 |
27 |
180 | ||
| 13:59:30 |
14:14:30 |
2.50 |
27 |
180 | ||
| 14:17:35 |
14:39:35 |
3.00 |
27 |
200 |
| UVCS Slit Position |
|
MOVIE of UVCS Slit on LASCO Images |
| Table 3 - UVCS Observation Wavelength Range |
| FITS filename |
Wave Min (A) |
Wave Max (A) |
| d99.04.22.13:07:28.ovi.dat |
1023.20 |
1043.80 |
| 980.400 |
993.400 |
|
| 1208.70 |
1220.60 |
|
| 975.800 |
979.200 |
|
| 1221.80 |
1224.90 |
| Table 4 - UV Properties |
| First Obs. | Max blue-shift (km/sec) | Max red-shift (km/sec) | Lines |
| 1999 04/22 13:08 | 45 | 0 |
HILya CIII977 |
| Images |
| Plots and mores |
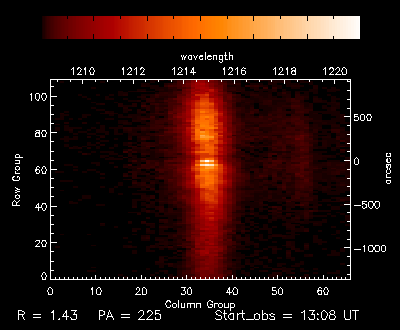
Transient blob in LyA at 1.43 Ro. Also appeared in C III and possibly OVI 1032. |
Transient blob only seen in LyA at 3.12 Ro. Faint with small blue shift. |
|
| Interpretation |
| Front | No |
| Void | No |
| Shock | No |
| Current Sheet | No |
| Prominence | Yes |
| Flare O VI | No |
| Leg | No |
| Helix | No |
| Comments |
Event seen by LASCO shows continuous outflows throughout the UVCS observing period. The LyA intensity along the UVCS slit shows some changes in morphology but the event is too faint to single out transient signal.
Last Update Thu Aug 9 14:07:14 2007